Note
Go to the end to download the full example code.
Error bars
The error_bar parameter of the pygmt.Figure.plot method
can be used to add error bars to data points.
The required argument has the following form: [x|y|X|Y][+a|A][+cl|f][+n][+wcap][+ppen]
In this tutorial different error bars related aspects are addressed:
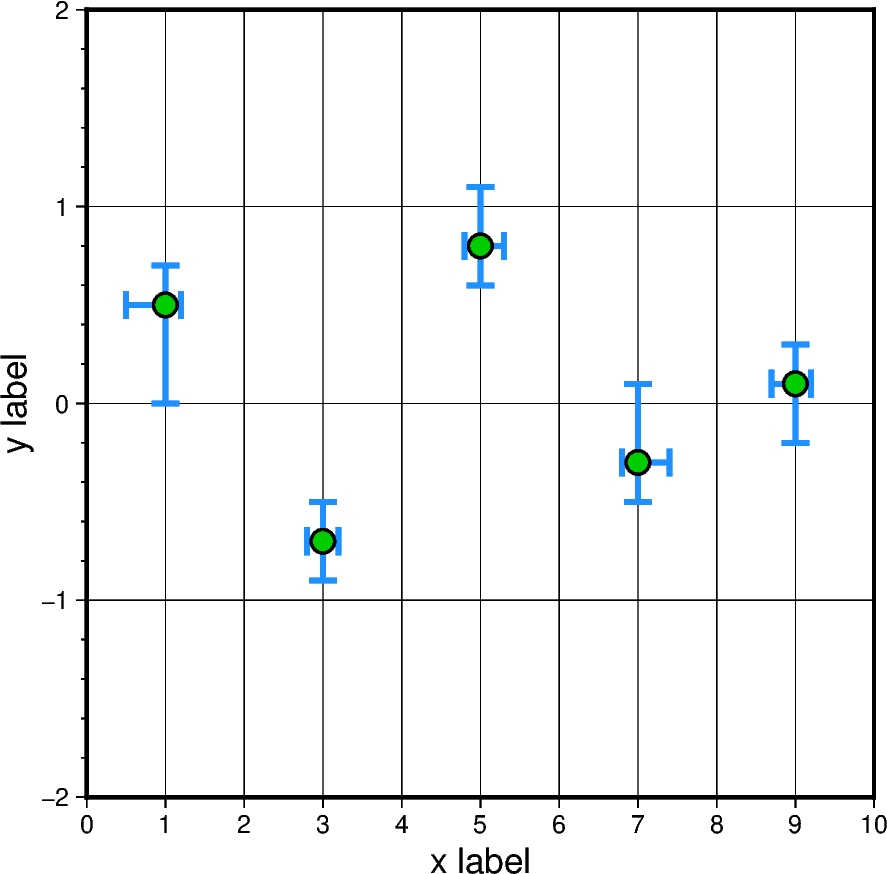
showing symmetric and asymmetric errors
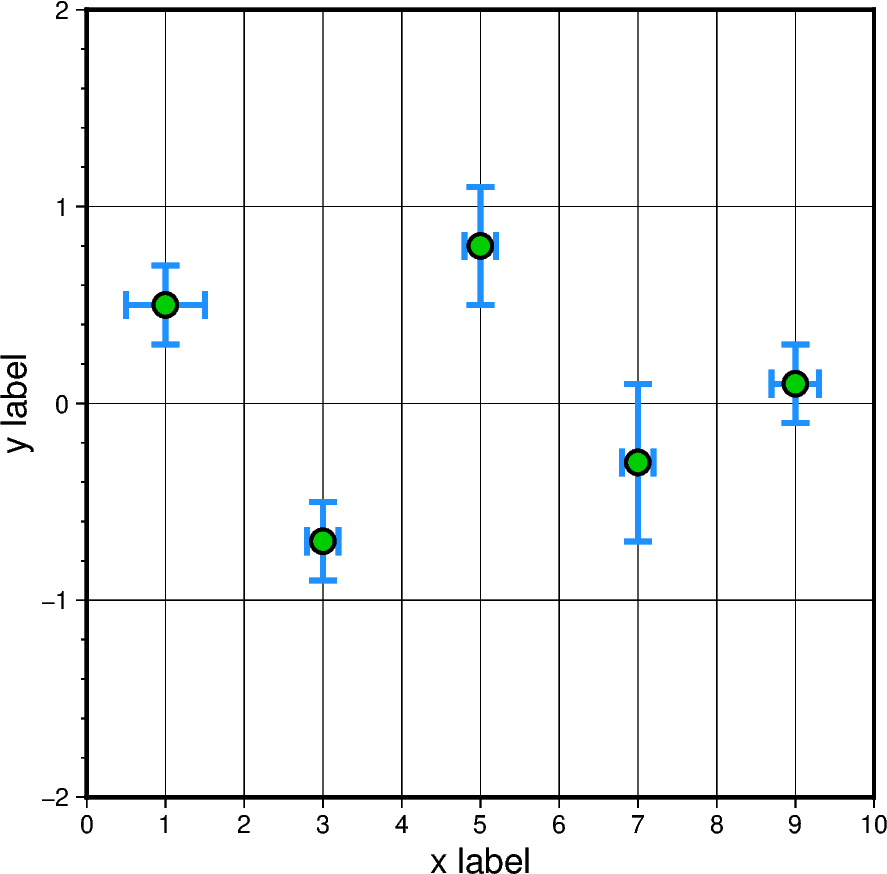
adjusting bars and caps
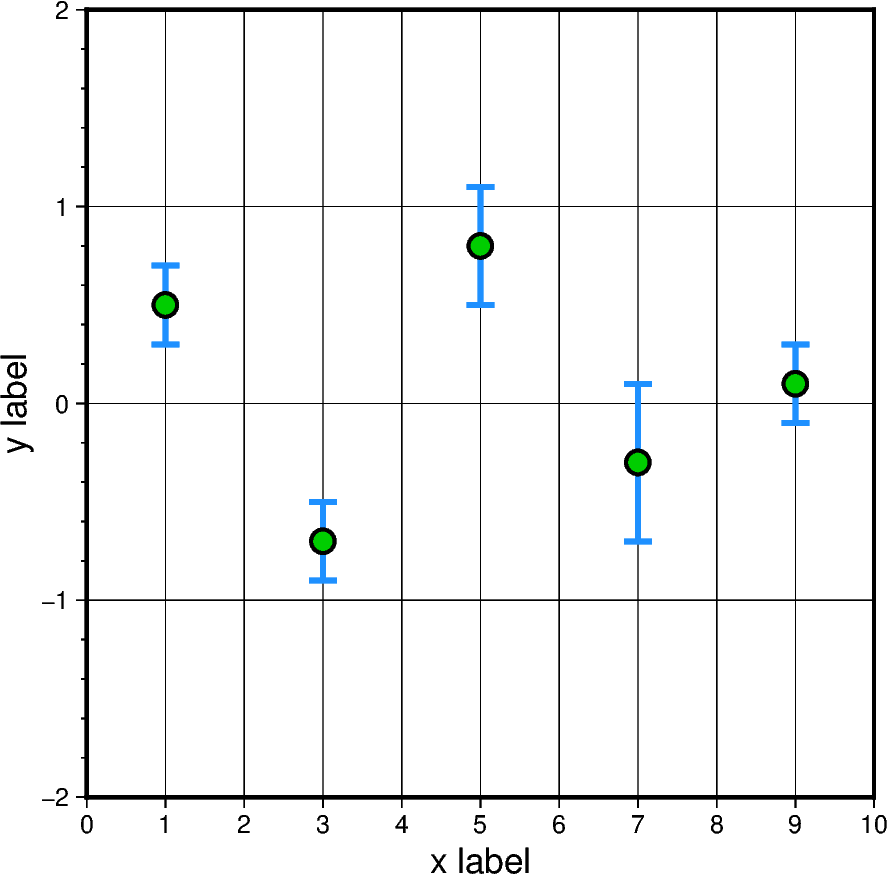
showing either x or y errors
using low and high bounds
using box-and-whisker (or stem-and-leaf) symbols
TODO
import pandas as pd
import pygmt
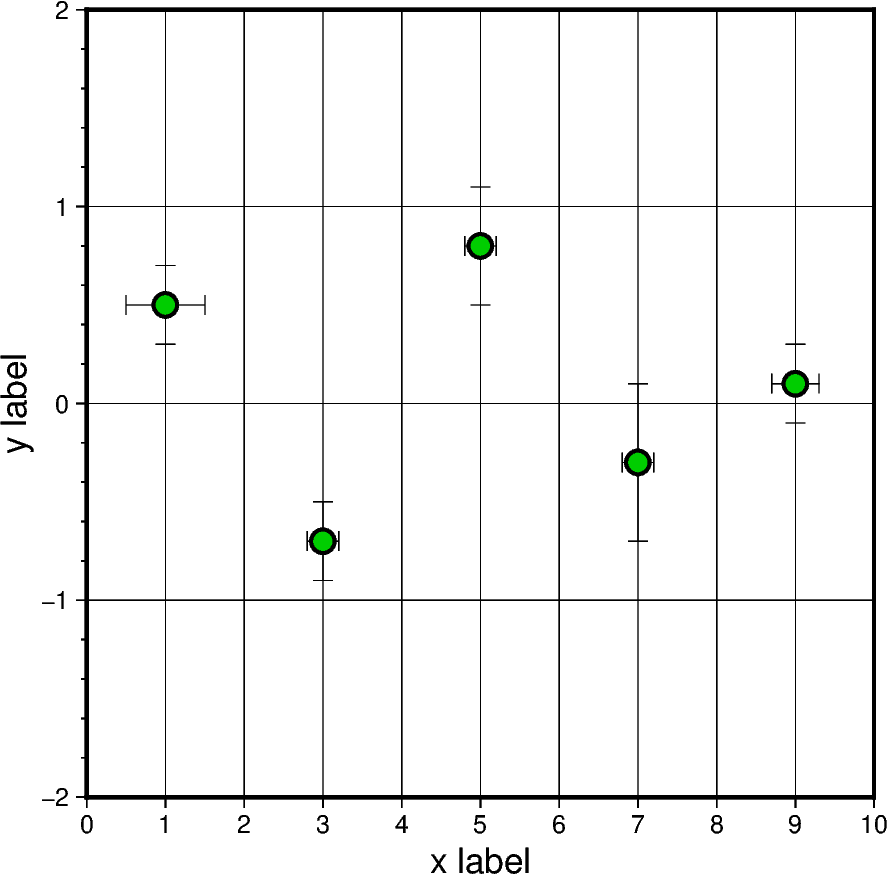
Symmetric error
# Define DataFrame with columns for x and y as well as x-error and y-error
df = pd.DataFrame(
    data={
        "x": [1, 3, 5, 7, 9],
        "y": [0.5, -0.7, 0.8, -0.3, 0.1],
        "x_error": [0.5, 0.2, 0.2, 0.2, 0.3],
        "y_error": [0.2, 0.2, 0.3, 0.4, 0.2],
    }
)

# Create Figure instance
fig = pygmt.Figure()

# Plot the data points
fig.plot(
    region=[0, 10, -2, 2],
    projection="X10c",
    data=df,
    # Add symmetric error bars
    error_bar=True,
    style="c0.3c",  # circles with a diameter of 0.3 centimeters
    pen="1.25p,black",
    fill="green3",
    frame=["a1fg1", "x+lx label", "y+ly label"],
)

fig.show()
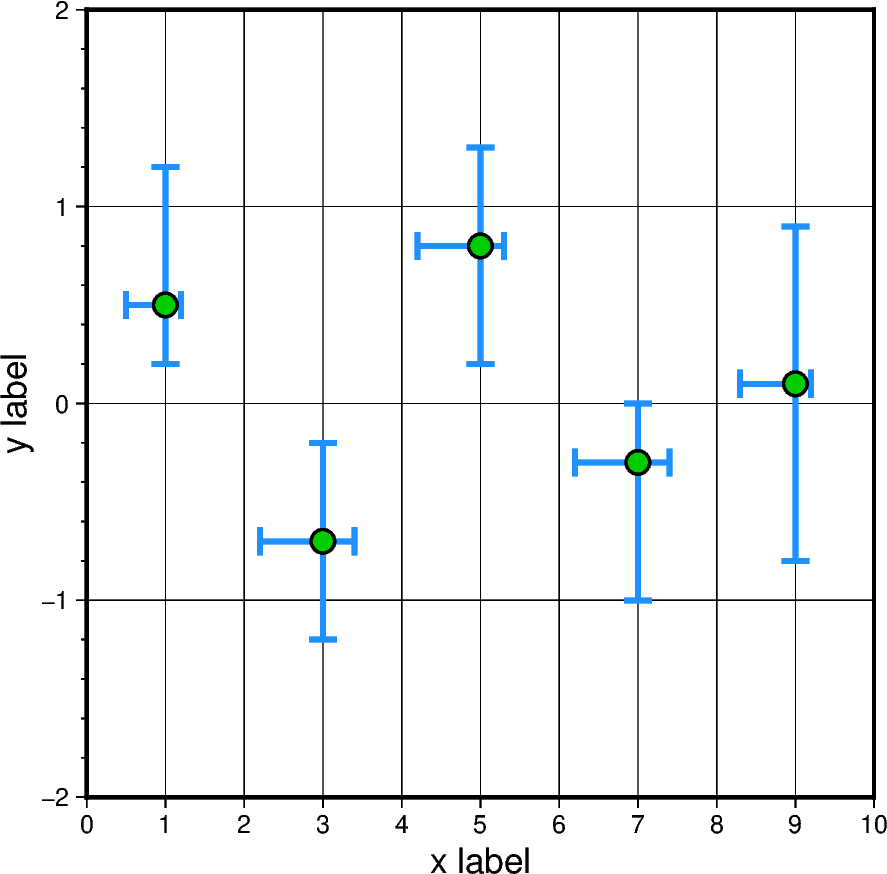
Adjust bars and caps
# Create Figure instance
fig = pygmt.Figure()

# Plot the data points
fig.plot(
    region=[0, 10, -2, 2],
    projection="X10c",
    data=df,
    # +w size of cap
    # +p width, color of bar
    error_bar="+w10p+p2p,dodgerblue",
    style="c0.3c",
    pen="1.25p,black",
    fill="green3",
    frame=["a1fg1", "x+lx label", "y+ly label"],
)

fig.show()
Plot error bars only for one axis
# Create Figure instance
fig = pygmt.Figure()

# Plot the data points
fig.plot(
    region=[0, 10, -2, 2],
    projection="X10c",
    data=df,
    # Add only error bars for the y direction
    error_bar="y+w10p+p2p,dodgerblue",
    style="c0.3c",
    pen="1.25p,black",
    fill="green3",
    frame=["a1fg1", "x+lx label", "y+ly label"],
    # Select needed columns, zero-based indexing
    incols=[0, 1, 3],
)

fig.show()
Asymmetric errors
# Define DataFrame with columns for x and y as well as lower and upper x-error
# and y-error
df = pd.DataFrame(
    data={
        "x": [1, 3, 5, 7, 9],
        "y": [0.5, -0.7, 0.8, -0.3, 0.1],
        "x_error_low": [0.5, 0.2, 0.2, 0.2, 0.3],
        "x_error_upp": [0.2, 0.2, 0.3, 0.4, 0.2],
        "y_error_low": [0.5, 0.2, 0.2, 0.2, 0.3],
        "y_error_upp": [0.2, 0.2, 0.3, 0.4, 0.2],
    }
)

# Create Figure instance
fig = pygmt.Figure()

# Plot the data points
fig.plot(
    region=[0, 10, -2, 2],
    projection="X10c",
    data=df,
    # +a asymmetric error bars
    error_bar="+a+w10p+p2p,dodgerblue",
    style="c0.3c",
    pen="1p,black",
    fill="green3",
    frame=["a1fg1", "x+lx label", "y+ly label"],
)

fig.show()
Low and high bounds
# Define DataFrame with columns for x and y as well as x and y low and high
# bounds
# TODO - adjust values
df = pd.DataFrame(
    data={
        "x": [1, 3, 5, 7, 9],
        "y": [0.5, -0.7, 0.8, -0.3, 0.1],
        "x_error_low": [0.5, 2.2, 4.2, 6.2, 8.3],
        "x_error_upp": [1.2, 3.4, 5.3, 7.4, 9.2],
        "y_error_low": [0.2, -1.2, 0.2, -1.0, -0.8],
        "y_error_upp": [1.2, -0.2, 1.3, 0.0, 0.9],
    }
)

# Create Figure instance
fig = pygmt.Figure()

# Plot the data points
fig.plot(
    region=[0, 10, -2, 2],
    projection="X10c",
    data=df,
    # +A low and high bounds
    error_bar="+A+w10p+p2p,dodgerblue",
    style="c0.3c",
    pen="1p,black",
    fill="green3",
    frame=["a1fg1", "x+lx label", "y+ly label"],
)

fig.show()
Box-and-whisker (or stem-and-leaf) symbols
Total running time of the script: (0 minutes 0.550 seconds)